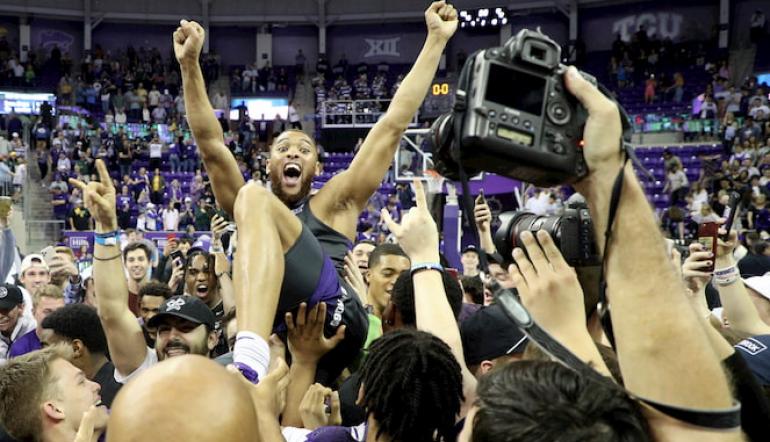
There is one basketball tournament that captivates America's attention like none other – NCAA March Madness.
There is one basketball tournament that captivates America's attention like none other – NCAA March Madness. According to the official data from NCAA Division 1 Men's Basketball, between 1970 and 2018, the attendance figures have steadily crept up over the years at many schools, but this pattern has not been consistent throughout. Given the large sample of data available to us, I have limited my date range to more recent years between 2010 and 2018, to include the Top 5 teams every year in that date range. It's still a large body of information to contend with, but it makes for interesting reading for all the basketball fans out there!
Ready to check out some NCAA basketball lines? Come on over to 888sport NJ and make your play on the hottest CBB teams.
March Madness Crowds - By the Numbers
2010
* Kentucky – Attendance 433,989 – Average 24,111
* Syracuse – Attendance 420,890 – Average 22,152
* Louisville – Attendance 368,537 – Average 19,397
* Tennessee – Attendance 306,680 – Average 19,168
* North Carolina – Attendance 337,934 – Average 17,786
2011
* Kentucky – Attendance 354,046 – Average 23,603
* Syracuse – Attendance 423,924 – Average 22,312
* Louisville – Attendance 458,463 – Average 21,832
* North Carolina – Attendance 287,155 – Average 19,144
* Tennessee – Attendance 341,130 – Average 18,952
2012
* Kentucky – Attendance 426,978 – Average 23,721
* Syracuse – Attendance 448,736 – Average 23,618
* Louisville – Attendance 430,052 – Average 21,503
* North Carolina – Attendance 362,867 – Average 20,159
* Wisconsin – Attendance 309,255 – Average 17,181
2013
* Kentucky – Attendance 415,775 – Average 23,099
* Syracuse – Attendance 426,347 – Average 22,439
* Louisville – Attendance 345,129 – Average 21,571
* North Carolina – Attendance 309,603 – Average 19,350
* Indiana – Attendance 330,832 – Average 17,412
2014
* Syracuse – Attendance 472,550 – Average 26,253
* Kentucky – Attendance 413,350 – Average 22,964
* Louisville – Attendance 383,070 – Average 21,282
* North Carolina – Attendance 324,458 – Average 18,025
* Creighton – Attendance 286,329 – Average 17,896
2015
* Syracuse – Attendance 429,378 – Average 23,854
* Kentucky – Attendance 447,874 – Average 23,572
* Louisville – Attendance 406,338 – Average 21,386
* North Carolina – Attendance 293,723 – Average 19,582
* Wisconsin – Attendance 276,464 – Average 17,279
2016
* Kentucky – Attendance 397,148 – Average 23,361
* Syracuse – Attendance 367,068 – Average 21,592
* Louisville – Attendance 396,333 – Average 20,859
* North Carolina – Attendance 293,219 – Average 18,326
* Maryland – Attendance 303,676 – Average 17,863
2017
* Kentucky – Attendance 398,850 – Average 23,461
* Syracuse – Attendance 444,809 – Average 21,181
* Louisville – Attendance 354,390 – Average 20,846
* North Carolina – Attendance 289,075 – Average 18,067
* Creighton – Attendance 296,013 – Average 17,412
2018
* Kentucky – Attendance 393,743 – Average 21,874
* Syracuse – Attendance 407,778 – Average 21,462
* North Carolina – Attendance 275,681 – Average 18,378
* Wisconsin – Attendance 310,901 – Average 17,272
* Creighton – Attendance 306,000 – Average 17,000
Interesting Insights from March Madness Data
This is truly compelling data. One of the first things that I noticed when I was researching the crowd numbers was the tendency of the top three positions to be occupied by Kentucky, Syracuse, and Louisville, typically in that order. While Kentucky doesn't always have the highest number of attendees for the season, it consistently ranks first or second in terms of average crowd capacity per game. This is a stunning tribute to the passion that the Kentucky Wildcats fans have for their college basketball team.
In fact, if we extrapolate beyond 2010 – 2018, in earlier years, the same trends are evident. Kentucky dominated in 2009, 2008, 2007, 2006, 2004, 2003, 2002, in 2001. The only year in that range when they didn't place first was 2005, when Syracuse dominated with 22,978 average crowd attendance. This data is important insofar as it supports many of our other research indicating which college basketball teams are the most heavily capitalized in terms of profit generation and net value. Our blog post on this very topic provides interesting insights into these top-tier teams, notably Kentucky, Syracuse, Louisville, North Carolina Indiana, Wisconsin, and Creighton among others.
In 2020, the NCAA March Madness Tournament kicked off to rapturous applause, but was cut short by the outbreak of COVID-19. This resulted in the cancellation and postponement of the basketball tournament. Nonetheless, basketball fans are always chomping at the bit for interesting data about their favorite teams, and we at 888sport NJ are happy to oblige with lots of tidbits of hoops trivia for you to enjoy.
Check out all the latest sports betting odds at 888sport NJ. If there is a local match taking place, you can bet your bottom dollar that we've got it covered!
Picture of NCAA Crowd - Richard Rodriguez AP
